Your SQL Server Database, Finally Visual
McSaver Searcher is a visual query builder and database analysis studio. Build SELECTs without writing SQL, chart any column, hunt down orphaned records, and find every view or procedure that quietly stopped working — all by pointing and clicking.
The Problem
- Orphaned foreign keys piling up unnoticed
- Broken views and stored procedures discovered by users
- Undocumented columns nobody remembers
- Slow unfiltered queries hiding in production
The Solution
McSaver Searcher turns the whole database into something you can click. Point at a table and it shows you the data, the value distributions, the dependencies, and the things that are quietly broken — then helps you fix them, safely. One studio, nine focused workspaces, zero SQL required.
Everything You Need to See Your Database Clearly
Visual Query Builder
Click tables, columns, filters, and joins. Watch the SQL build itself and results stream in. Supports aggregates, ordering, ranking, window functions, and expressions — without typing a SELECT.
Table Editor & Live Charts
Excel-style filtering and sorting on any table. One click turns a column into a chart so outliers and skew jump out — eleven chart types, no export needed.
Orphan Finder
Scan every foreign key for child rows whose parent is gone. Generate transactional cleanup scripts with row-count guards that roll back on mismatch — safe by default.
Database Analyze
Score your schema against best-practice rules — missing keys, naming, indexing, documentation. Auto-generated T-SQL fixes come ready to review and run.
Broken-SQL Validator
Validate every view, stored procedure, and function against the live schema. Surface the ones that no longer compile before your users find them.
Investigate & Data Chain
Drill into column usage, distinct value distributions, and dependencies in both directions. Build dependency-ordered delete chains that respect every foreign key — fully transactional.
Write SQL by Clicking, Not Typing
Pick a root table, check the columns you want, drag conditions into groups, and McSaver Searcher writes the SELECT for you — joins, GROUP BY, window functions and all. The generated SQL and the results update as you go.
- Tables, joins, filters, aggregates & ordering — visually
- ROW_NUMBER, RANK, LAG/LEAD, percentiles & expressions
- Save as criteria, SQL, view, procedure or function
How a Query Comes Together
Build it by pointing and clicking, watch the SQL write itself, then get answers — no hand-coding at any step.
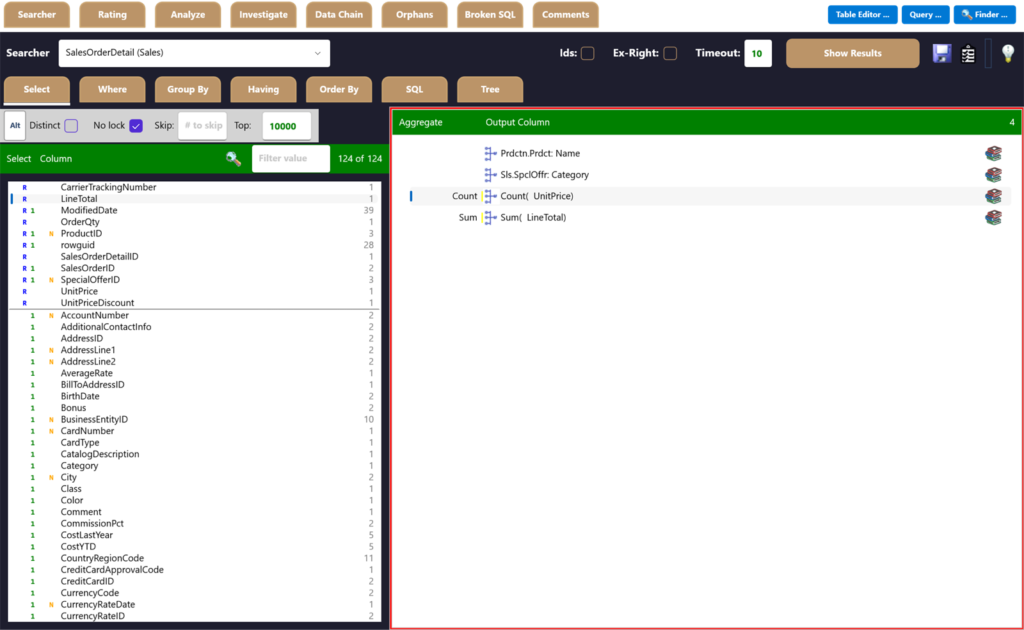
Pick Columns & Aggregates
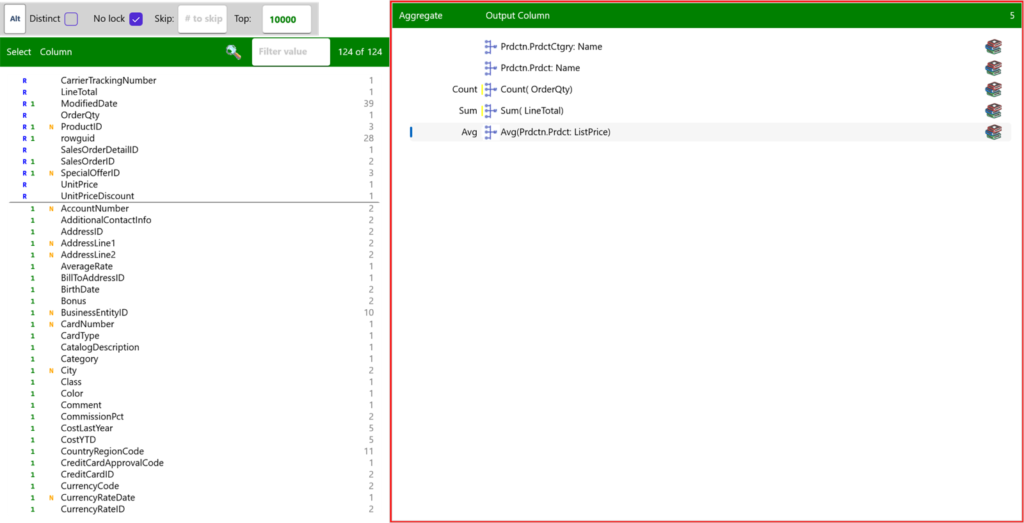
Choose output columns and add COUNT, SUM and AVG visually — here, product category and product name with order quantity and line-total rollups.
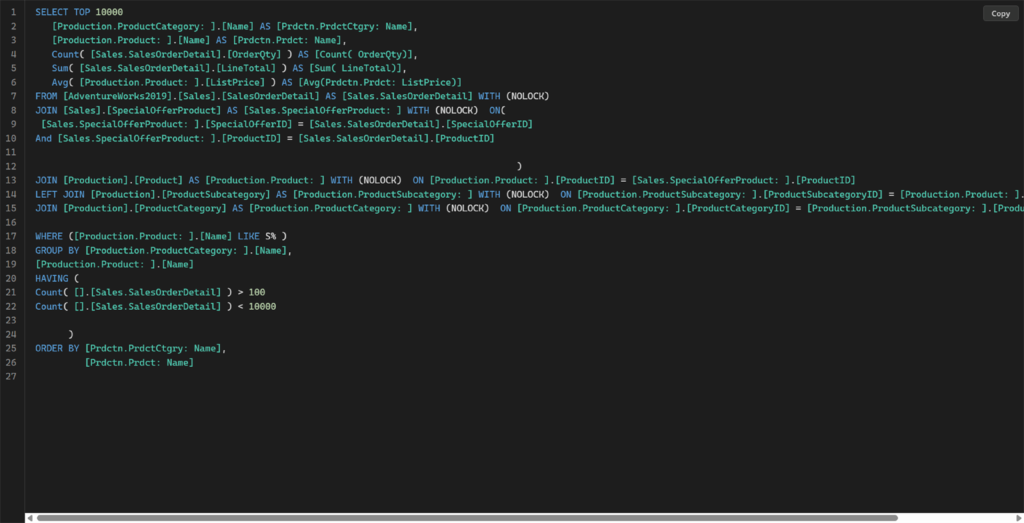
The SQL Writes Itself
Joins, GROUP BY, HAVING and ORDER BY are generated for you from the choices above — review or edit the raw T-SQL any time.
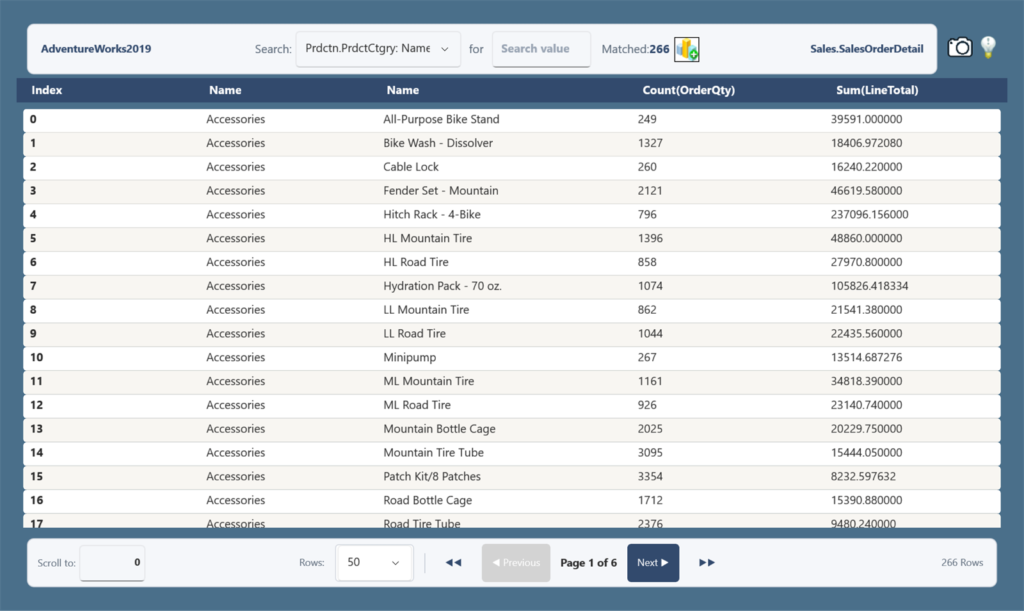
Run & Get Answers
Execute and page through real results — 266 product categories here, each with its order count and summed line total.
Window Functions & Expressions, Built Visually
On the Select tab, the dictionary icon on any column opens an advanced editor — ranking, windowed aggregates, percentiles, offsets, and free-form expressions — so you get the power of OVER() and computed columns without writing the syntax.
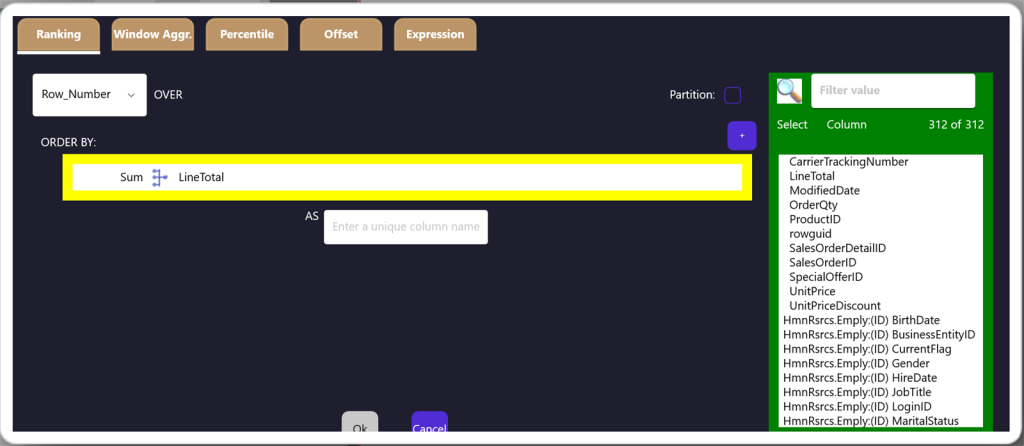
Ranking
Number or rank rows within a partition — ROW_NUMBER, RANK, DENSE_RANK — ordered however you choose, without collapsing the rows. Ideal for "top N per group" and leaderboards.
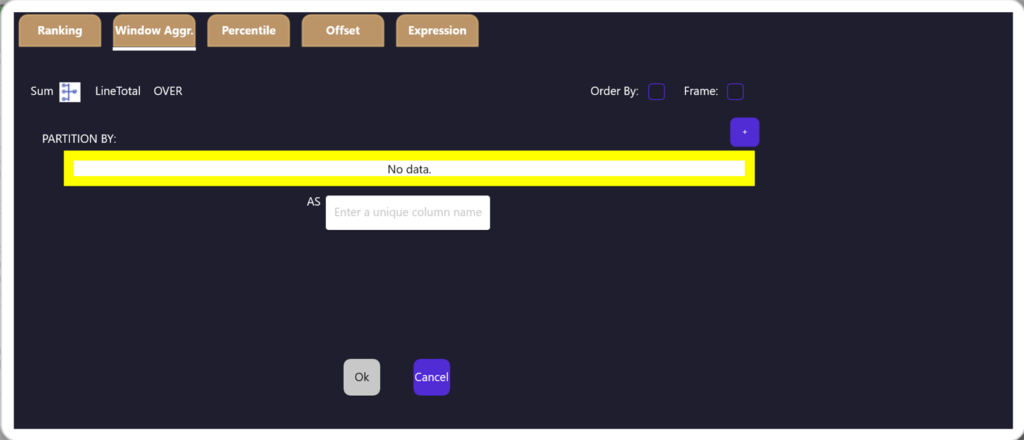
Window Aggregate
Run SUM, AVG, COUNT, MIN/MAX OVER() a partition, so every row keeps its detail and shows the group total beside it — running totals and percent-of-group made easy.
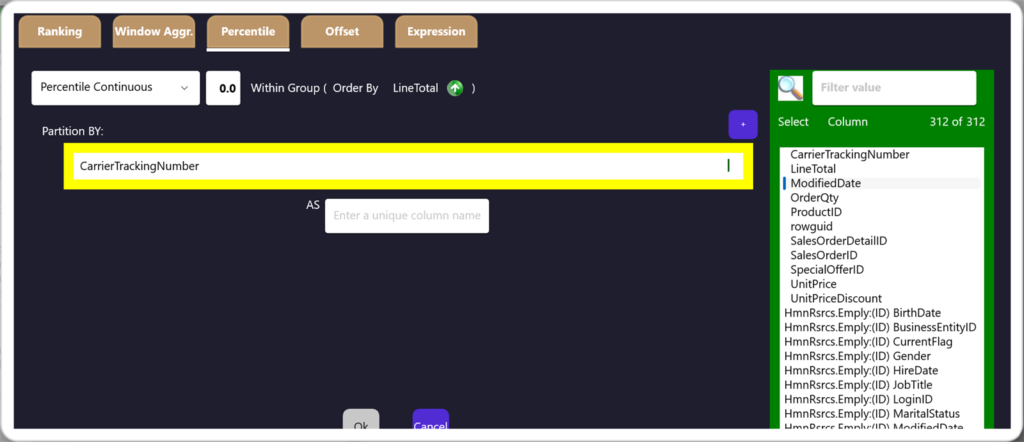
Percentile
Report medians and percentiles — PERCENTILE_CONT or PERCENTILE_DISC — within an ordered group, so you describe the middle of the distribution, not just the average.
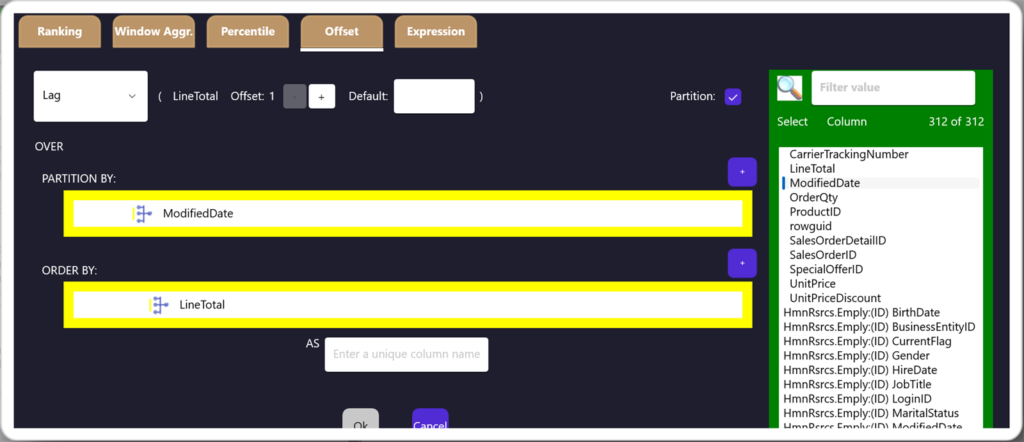
Offset
Compare each row to its neighbours with LAG and LEAD — pull a value from a prior or following row, with an offset and a default, for period-over-period change.

Expression
Write a free-form formula like @0 * @1 / @2 and map each placeholder to a column — calculated columns, ratios, and CASE logic that live in the query, not a downstream spreadsheet.
From Query to Chart in One Click
Pick two columns, choose a type, and the Charting Window draws it instantly. No export, no spreadsheet, no pivot dance — your result set becomes a chart right where you searched.
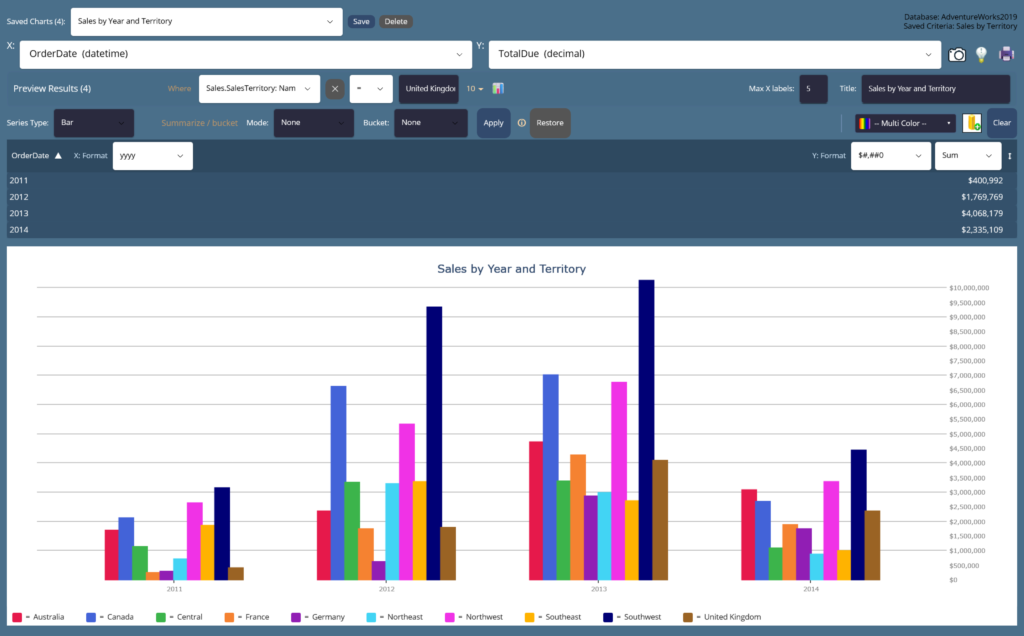
Define your charts once. Then run — and rerun — the same set with the latest data whenever you need it, without touching the selection criteria. A couple of clicks refreshes every chart at once, ready to print.
Single Series, Instantly
One column on X, one on Y — that's a chart. Bucket, summarize, and relabel inline, then flip between Bar, Line, Area, or Pie without re-running the query. The shape of your data shows up before you finish thinking about it.
Multiple Series, Just as Fast
Add more series and compare them side by side on the same axes — grouped bars, layered lines, stacked areas. Color, legend, and scaling are handled for you, so a multi-series comparison is the same one click as a single one.
Eleven Chart Types in the Type Dropdown
Take Any Result With You
Everything you see on screen leaves the app in one click — six file formats for grids, a printer icon for the current chart, and a right-click for the whole stack of saved charts as a single PDF.
Six formats. One click.
Every results grid and Table Editor view has an export icon next to the chart button. Pick the format, choose a location, done — your export folder opens automatically so the file is right there waiting.
Print one chart, or every chart at once.
The printer icon on the Chart Window hides the controls, fills the page, and prints landscape. Right-click the same icon and a checklist of every saved chart pops up — tick as many as you like and send them all to a printer, or straight into one multi-page PDF.
- Left-click — print the current chart, full-page, landscape.
- Right-click — checklist of saved charts with Select All.
- Send to: any installed printer, or Save as PDF.
Screenshot Any Workspace
A camera icon sits at the top-right of every workspace. Click it and a PNG lands in your export folder — which opens automatically so you can drag it straight into a doc or ticket.
SQL to Clipboard, File, or Database
The Save SQL dialog offers three destinations — paste it into another tool, drop it in a script folder, or store it as a saved query in the database itself. Every visual query round-trips back.
Batch to a Single PDF
Ticking ten charts in the print picker produces one PDF, ten pages, one per chart, each full-size and landscape. Weekly reports go from "assemble slides" to one right-click.
Everything on this page — all six formats, every print path, screenshots, PDF batches — ships in the Base tier and works the moment you activate.
Real Screens, Real Data
Every workspace below is McSaver Searcher connected live to a sample database. Click any image to enlarge.
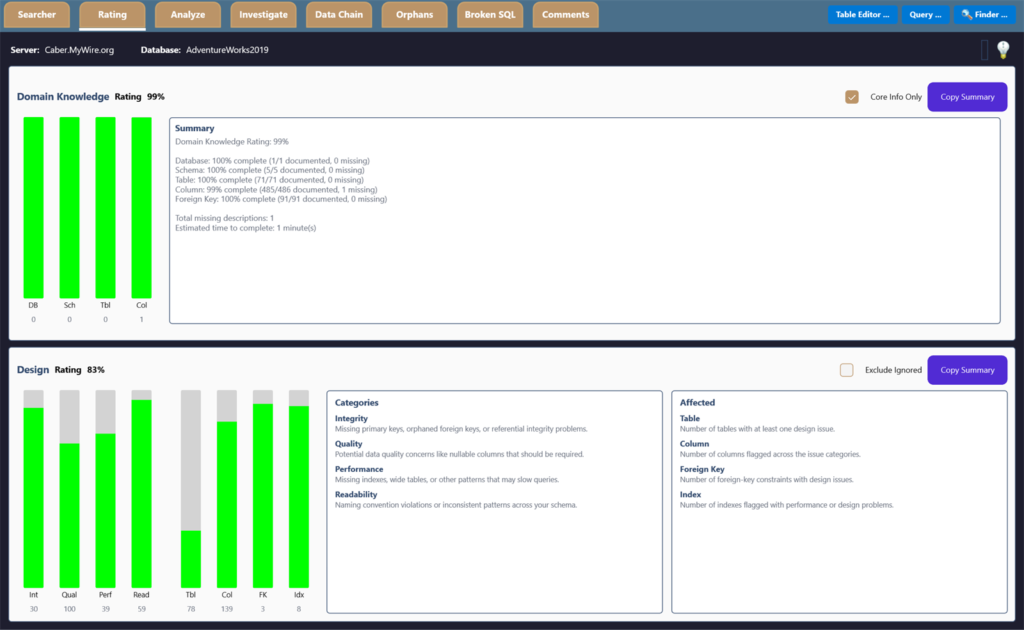
Score Your Schema at a Glance
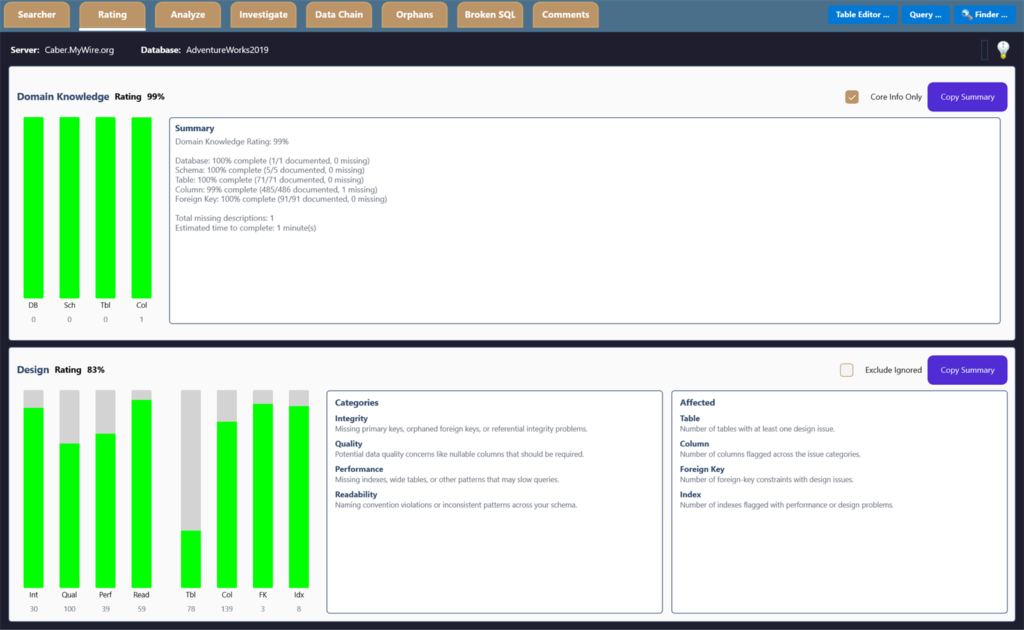
Domain-knowledge and design ratings break down across tables, columns, keys and indexes — and climb as you fix things.
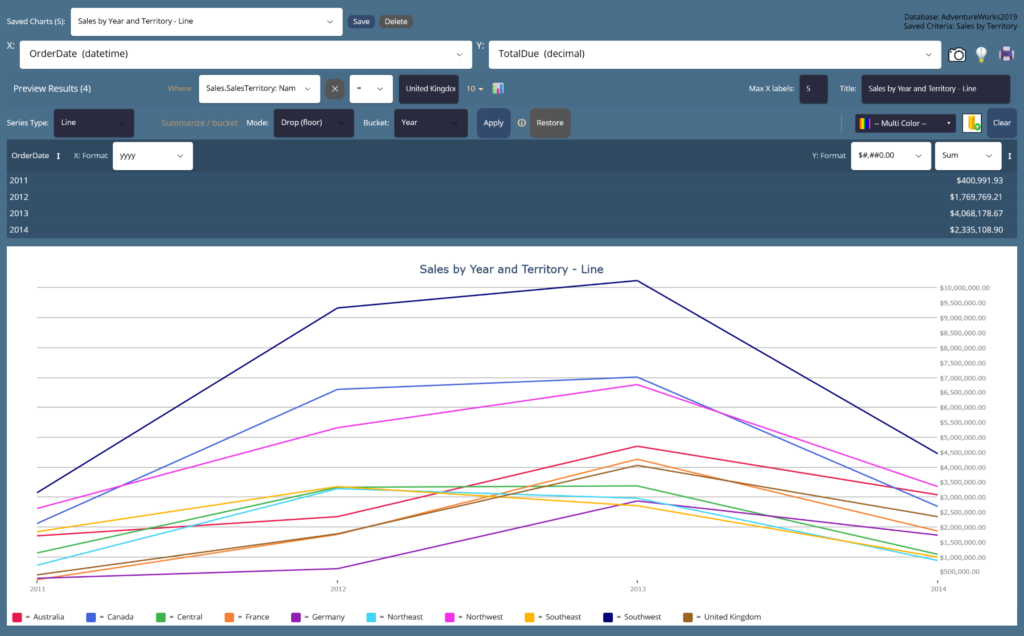
Chart Any Column on the Fly
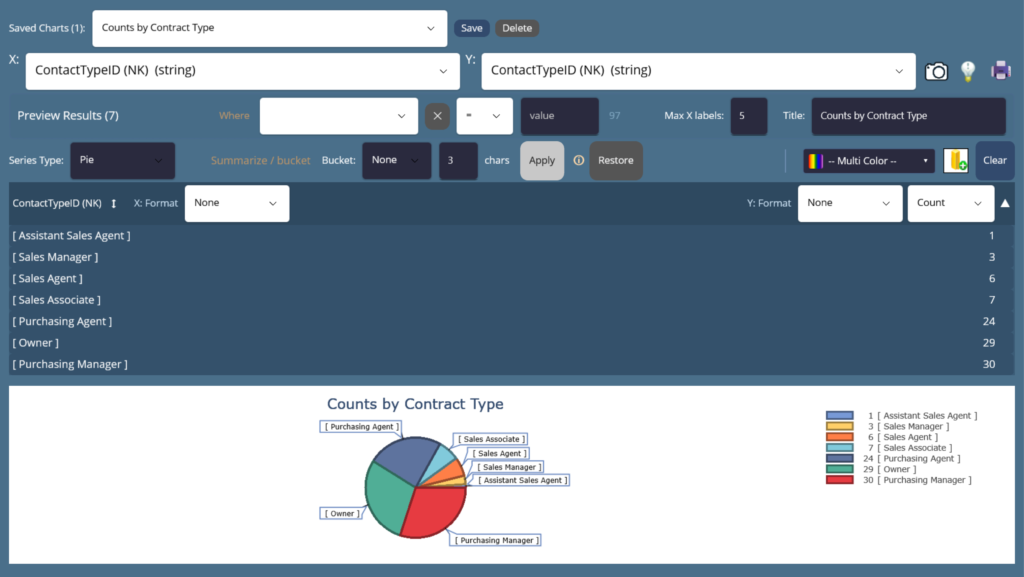
Bucket, summarize and plot value distributions instantly to spot outliers and skew — eleven chart types, no export needed.
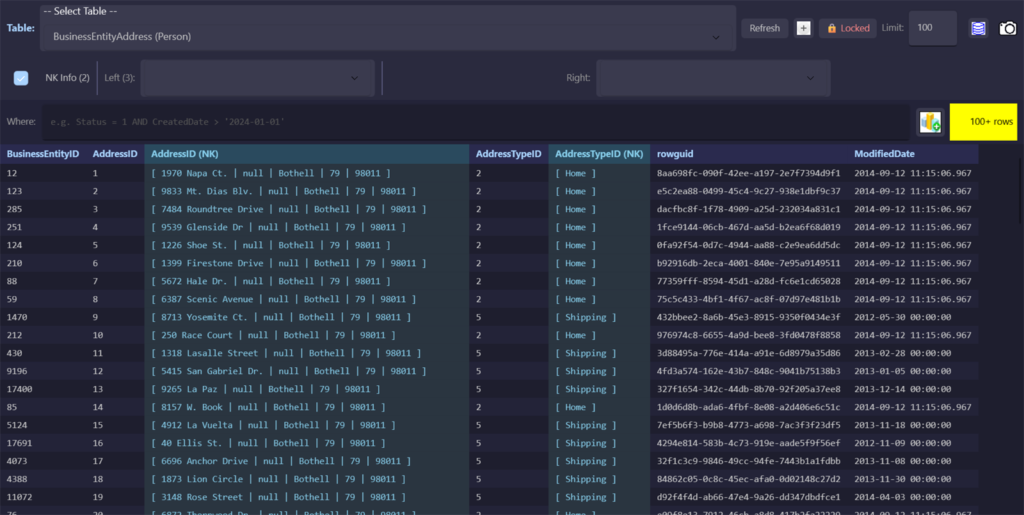
Browse and Edit Any Table
Excel-like filtering and sorting on every column, with natural-key info and one-click foreign-key navigation left and right.
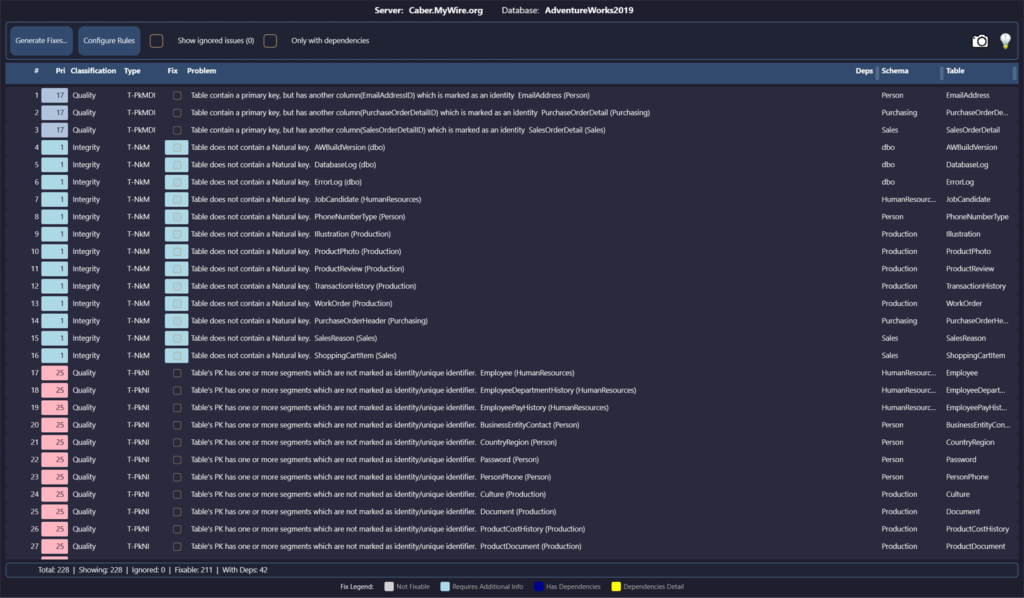
Find Every Best-Practice Gap
Integrity, quality, naming and documentation rules scored across the whole schema, each with generated T-SQL fixes.

Hunt Down Broken Relationships
Scan every foreign key for child rows whose parent is gone, then generate safe, transactional cleanup scripts.
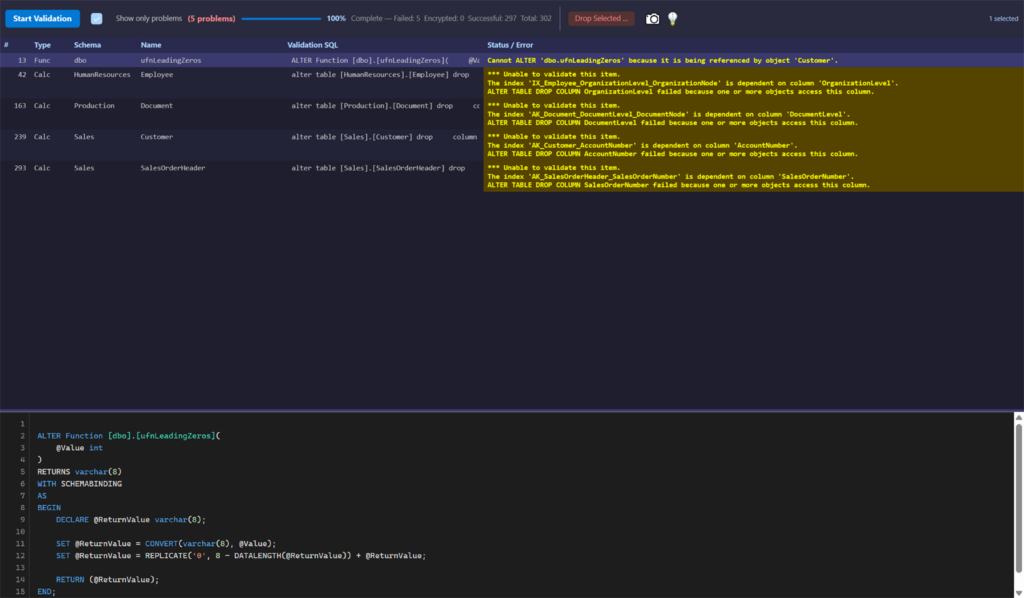
Catch What Stopped Compiling
Validate every view, procedure and function against the live schema — surfaced in seconds, before your users find them.
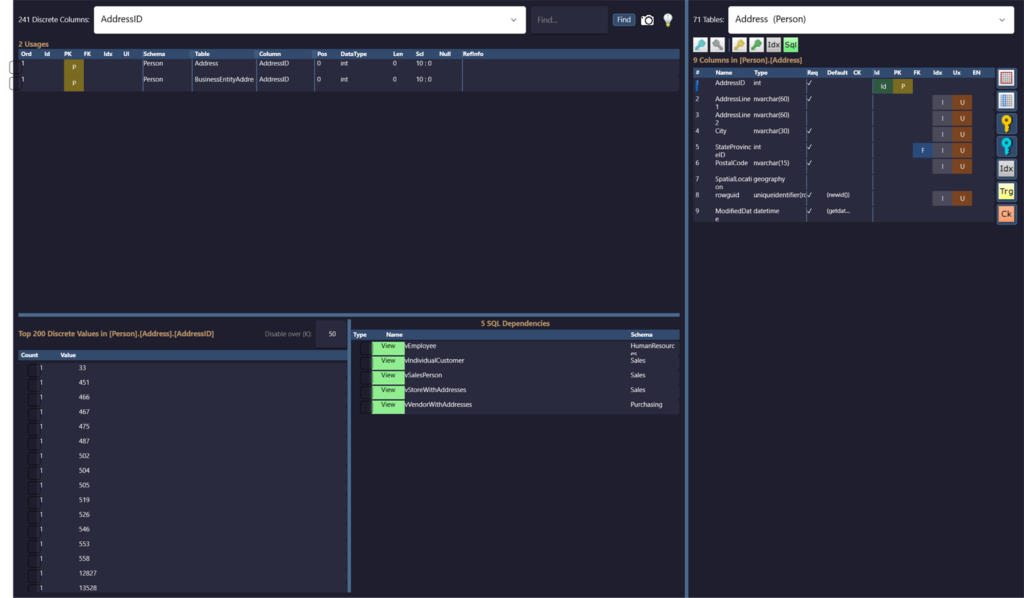
See What References What
Drill into a column's usages, discrete value distribution and every dependency — in both directions across the database.
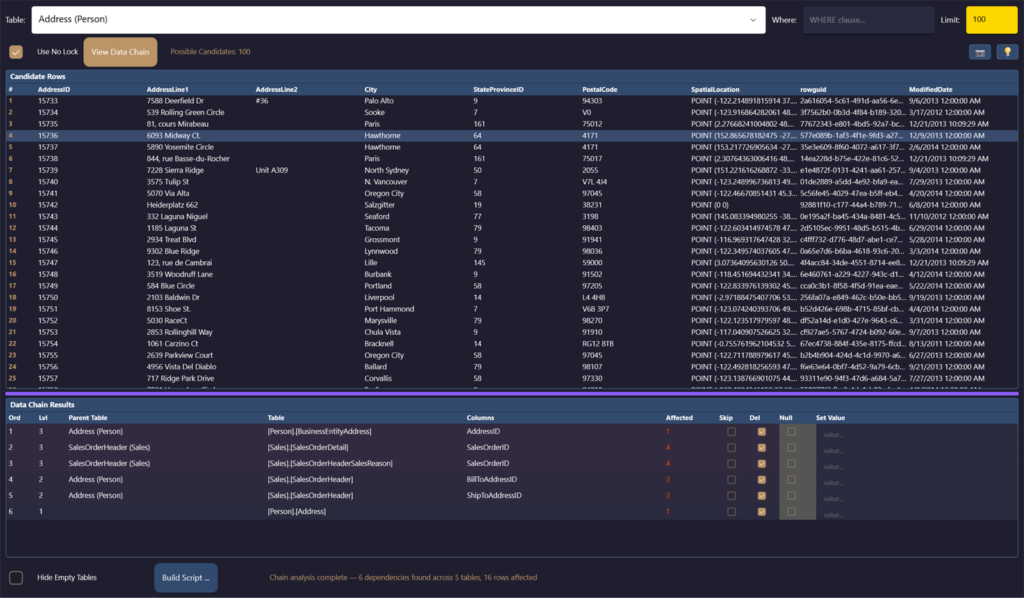
Delete in the Right Order
Build transactional, dependency-ordered delete scripts that respect every foreign key — a record and all that hangs off it.
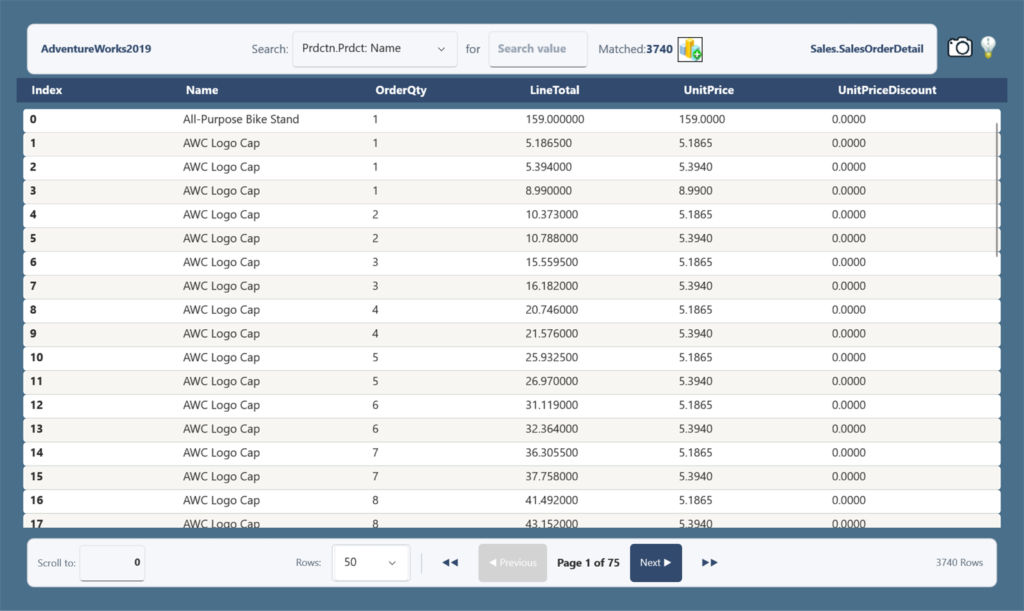
Query Without Writing SQL
Pick predicates, run, and page through results — thousands of matched rows, no code required.
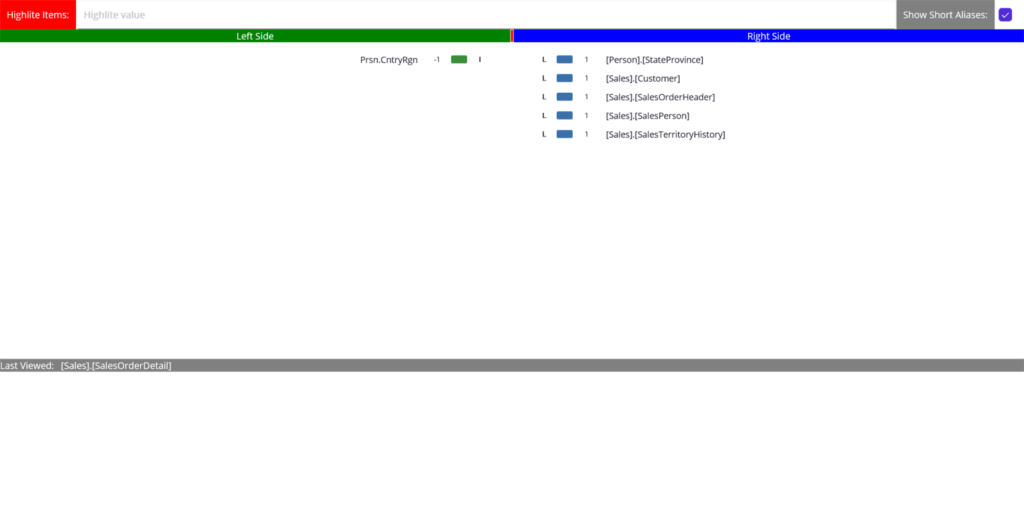
Navigate the Relationships
Browse the schema as a tree — pick any table and see what it links to on the Left and Right of the join path, then re-root your query on any of them.
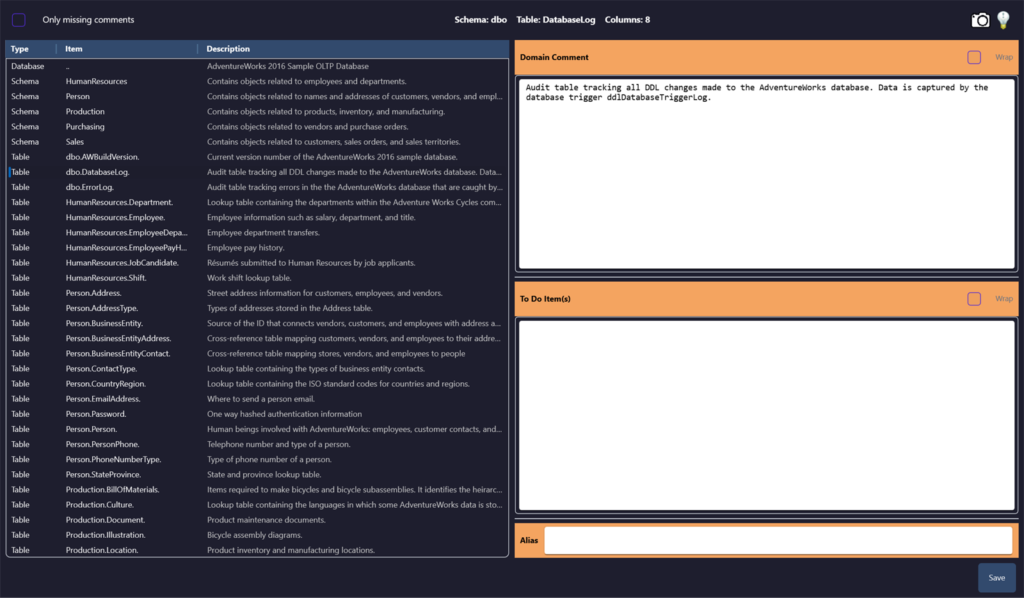
Document It in Place
Manage extended-property descriptions, to-dos and aliases that flow back into tooltips and your generated queries.
Help, Right Where You Need It
McSaver Searcher explains itself as you work — and a full manual set is one click away whenever you want the complete picture.
💡 Context-Sensitive Tip of the Day
Every workspace carries its own rotating tips. Click the lightbulb icon in any tab's header to cycle through guidance written specifically for that view — from the Searcher's query-building shortcuts to the Orphans scanner's safety notes and the Chart window's series types.
📄 A User Manual for Every Tab
Twenty-six PDF manuals — one per tab and sub-tab — each covering Who, What, When, Where and Why, with a screenshot and the tab's complete Tip of the Day list. Download any of them below.
Main Feature Tabs
Window-Function Tabs
Window-Level Tools
Results & Visualization
What We Track — and What We Never Touch
McSaver Searcher runs on your machine, against your database. Here is exactly what does and doesn't see.
What We Collect
- Your email address — it's how you sign in and how we reach you.
- Your login password — kept only as a secure one-way hash. We can never read or recover it.
- Which features you use, and how often — Searcher, Rating, Analyze, Investigate, Data Chain, Orphans, Broken SQL, Comments, Table Editor, Query and Finder — so we know what to improve.
- Your purchases and subscriptions — the plan, amount and status, so we can manage your license (never your card).
- For security & licensing — your name (if you give it), the computers you activate on, your app version, and sign-in activity including IP address.
What We Never See or Store
- Your credit-card details — payments go straight to Stripe. We only ever receive Stripe's confirmation, never your card number, expiry or CVV.
- Your database password — it stays on your computer, encrypted, and only if you choose to save it. It is never sent to us.
- The SQL you write or the data you browse — your queries and the tables, columns and rows you look at never leave your machine.
- Your mailing address — we don't collect it; if a purchase ever needs one, Stripe handles it.
- Your location — we don't track or infer where you are.
Diagnostic logs may include account identifiers to troubleshoot errors.
Three Steps to a Database You Can See
Connect to Your Database
Point Searcher at any SQL Server or Azure SQL connection. Schema, keys, and procedures load in seconds — no setup, no project files.
Click, Don't Type
Build queries, scan for orphans, score documentation, validate every view — all by pointing at what you want to look at. No SQL syntax in your way.
Apply Safe Fixes
Every generated cleanup script is transactional and guarded with row-count checks. Review it, run it, move on — confident it can't make things worse.
Why Teams Choose Searcher
Stop Writing Boilerplate SQL
The visual builder generates correct, formatted SELECTs with joins, filters, windows, and ranking. Spend your time on the question, not the syntax.
Find Hidden Database Rot
Orphaned rows, broken views, undocumented columns — all surfaced before they reach production. Built-in scoring tells you what to fix first.
Fix Things Safely
Every cleanup script wraps in a transaction with row-count guards. If the numbers don't match, the change rolls back — your data stays safe.
Two Editions, One Studio
Start with Base at $19.99 — every visual query you'd want, every chart your data deserves. Step up to Pro at $49.99 when you're ready to repair the schema itself, not just query it.
Searcher Base
Write SQL by clicking. Chart any column. One simple price.
- Searcher — full visual query builder with joins, aggregates, GROUP BY, window functions and expressions
- Rating — visual analysis of your schema with an executive summary across tables, columns, keys and indexes
- Built-in Charting — all eleven chart types, one click from any result set
- Save queries as SQL, view, procedure or function
Searcher Pro
Repair the database, not just query it.
- Analyze — score the schema against best-practice rules and generate T-SQL fixes
- Data Chain — build transactional, dependency-ordered delete scripts that respect every foreign key
- Investigate — drill into column usage, value distributions and dependencies in both directions
- Orphans & Broken SQL — hunt orphaned rows and catch views that no longer compile
- Comments — manage extended-property documentation across the database
- Finder — full-text search across every view, procedure and function
- Table Editor & Query — Excel-style browsing and a saved query manager
We Care About What You Think
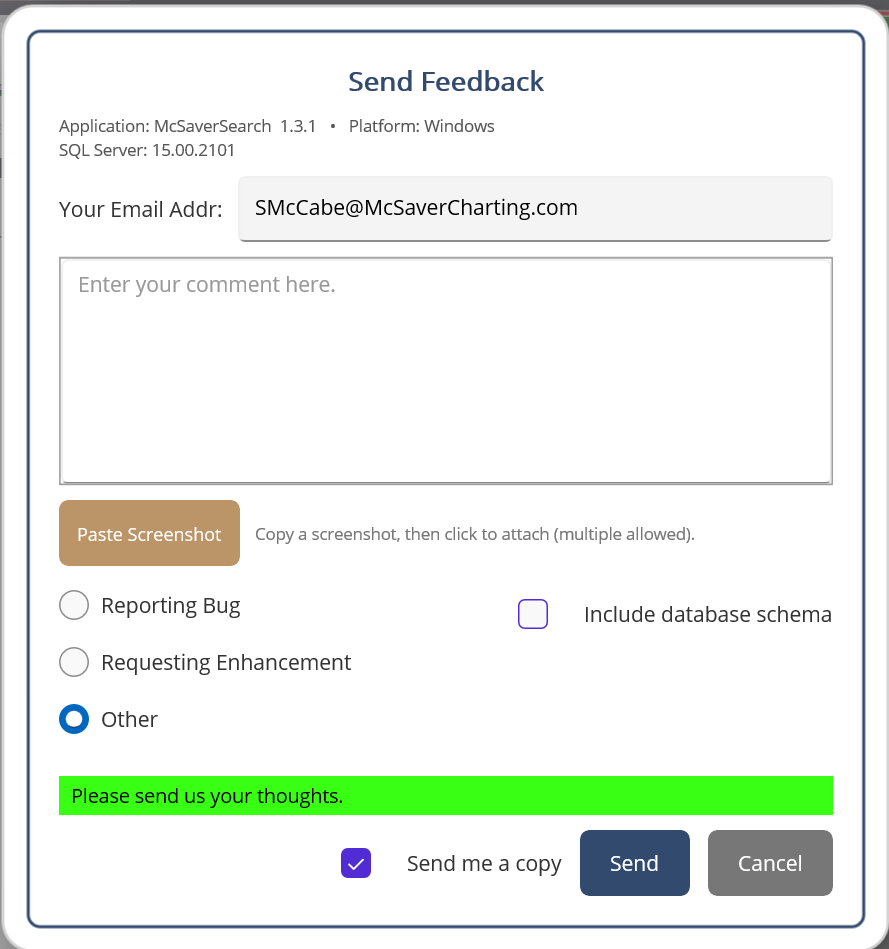
Built right into McSaver Searcher — paste a screenshot, drop us a note, attach your schema if it helps. We read every message, and the next release ships from real user feedback.
Download McSaver Searcher for Windows
One installer. Run it, connect to a SQL Server, and you're querying visually in under a minute. Base features work out of the box — activate Pro later when you're ready.